

Case Study One:
StreamSong Advisors: Navigating COVID-19
July 2020
What happened??
As Kirk Gibson rounded the bases to win Game 1 of the 1988 World Series, announcer Jack Buck voiced the immortal description, “I don’t believe what I just saw!” At the time, Buck had been broadcasting Major League Baseball for 34 years, so his proclamation of exclusivity was not to be taken lightly. Now, having professionally managed clients’ investments for over 31 years, I can utter the same words as Jack to describe the first half of 2020, “I don’t believe what I just saw.”
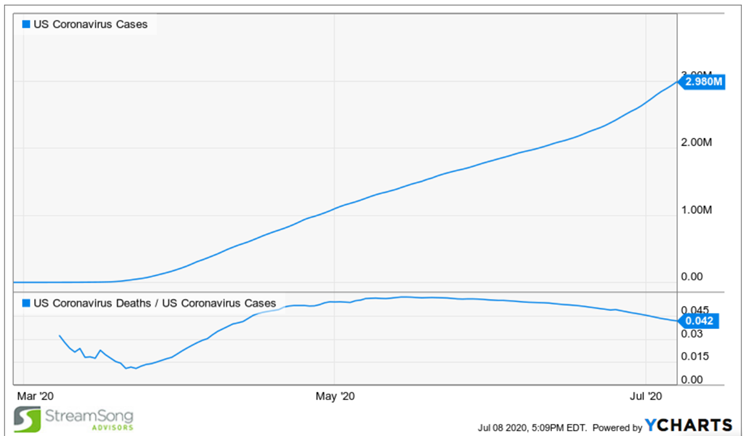
There were 555 worldwide cases of COVID-19 on January 22, 2020 when Johns Hopkins started keeping track. By the end of June, that number had climbed to 10.5 million. The global economy slammed to a halt as we attempted to “flatten the curve” and not overwhelm the healthcare system. Governments and central banks around the world poured massive amounts of liquidity (cash) into the system to provide relief. Even Jerome Powell, Chairman of the Federal Reserve was quoted as saying, “We crossed a lot of red lines that had not been crossed before, and I’m very comfortable that this is that situation in which you do that, and then you figure it out afterward.” To paraphrase, “Get cash into the system now! We’ll figure out how to pay for it later!”
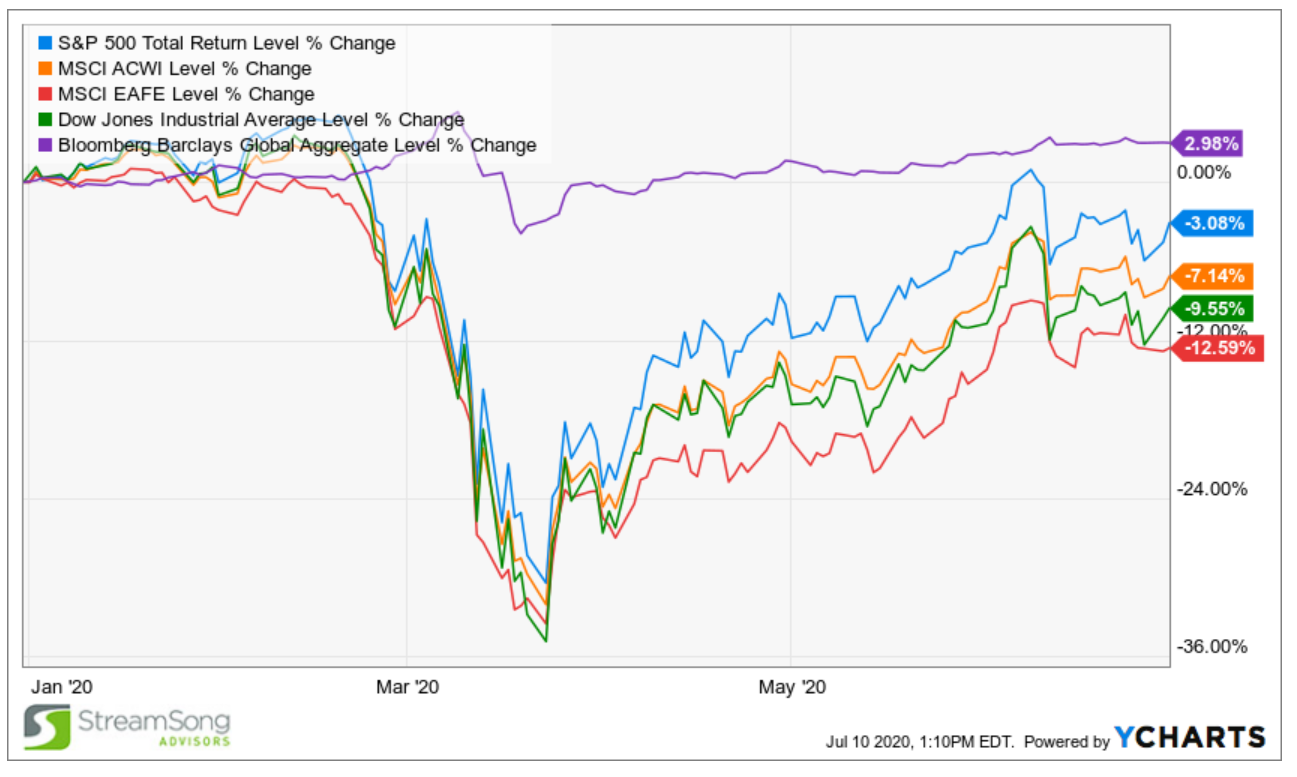
The financial market’s response was dramatic and violent as it cratered due to the shutdown, then sharply rebounded on hopes of liquidity, bailouts, a cure and a quick reopening. In the matter of a couple months, we saw a bear market and a new bull market amidst record setting economic data and historical social turmoil.
- The fastest move from bull market to bear market since 1933 (defined as 20% from the top) as it took just 16 trading days from the peak on February 19 for the S&P 500 to go from +5% year-to-date to -26% on March 12.
- Stocks bottomed on March 23 after falling 34% from the peak just a month earlier. This was the fastest 30% decline in the market’s 124 year history.
- Just 12 trading days later, the index was 20% higher, breaking the record as the fastest return to a new bull market.
- The U.S. economy officially entered a recession in February ending the longest economic expansion in history (10 years and 8 months).
- The S&P 500 actually got back to a positive year to date return on June 8. Unfortunately, like a tag up in hockey, it crossed that line for 2 days, then promptly want back into the red where it remains.
What did we do?
We built StreamSong Advisors to provide a better solution for investors by being more pro-active, nimble, purposeful and thoughtful. All of that was put to the test in those past 6 months. And while we didn’t get all of the calls right, we are pleased to have added value to clients’ portfolios over the tired “stay the course” mantra. Managing portfolios is often like flying a jumbo jet which requires setting a long-term plan then making minor adjustments along the way. This year, it has been more like flying a fighter jet where you make dramatic adjustments and quick moves to win the battle - then resume your heading. At one point we measured our total trading volume and it was over 10X that of a normal year.
In late February of 2020, we sold out of all international exposure which brought overall equity allocations down by roughly 15%. Our theory was that the U.S. would be better able to handle the pandemic. That may or may not prove true, but foreign markets have lagged our own since then.
In early March, as it became more evident that the virus was going to have a dramatic impact on the domestic economy, we sold out of small caps and took gains in other areas. This reduced equity allocations down to 30% - 50% of normal targets and further cushioned portfolios from the downturn.
We started to gradually and opportunistically rebuild equity exposure with stocks that had been hit too hard and stocks that would win in the “New World.” This pandemic will have a 9/11 like effect in that things will get back to normal, but that normal will have shifted. In some cases, the shift will simply be an acceleration of trends already in place. However, there are some new trends that will likely take hold, while others may prove more temporary.
Examples include:
- Shopping more online and less at the physical store.
- Working from home and meeting virtually rather than traveling in person.
- Electronic gaming and streaming, as sports and entertainment shifts from the field, court and track.
- Getting outside and enjoying nature and recreation more than malls and amusement parks.
- Bringing supply chains back home.
- Continuing to increase the use of cloud computing, which also increases the need for bandwidth, speed (5G) and cybersecurity.
- Working out at home instead of the gym.
- Cooking or delivery and Netflix rather than a dinner and movie out.
- Increasing need in biotech to speed the discovery of new drugs, with regulations likely allowing shorter times to market.
Throughout this unstable period, we also hedged and sheltered portfolios through the use of inverse and volatility ETFs. This also helped smooth the edge of the downside.
What now?
The market has largely determined that the threat from COVID-19, while not behind us, is measurable and not economically catastrophic. We do not think a second wave of the virus would result in a second complete shutdown of the economy. Instead, we will just power through it and there will continue to be virus-related volatility, which could get dramatic again depending on the number of cases and severity. Life is far from back to normal. One silver lining so far, however, is that while the number of cases has started to spike again, the number of COVID-19 related deaths has not seen the same trajectory. This may prove a lagging indicator, but so far, that has been relatively good news.
It has been said repeatedly and logically that Wall Street and Main Street are disconnected. That the current rally has been artificially induced by the massive amount of liquidity and makes no fundamental sense. And that the amount of debt taken on is unsustainable and will eventually lead to a collapse of the house of cards. All of those are sound and reasonable arguments. So why does the market keep going up?
- Markets are often illogical and can stay that way for longer than makes sense. If it were simply a math problem, we would all get the same answer and there would be no market. Emotions play a huge part over the short / intermediate term, the strongest of which are fear and greed.
- There is over $18 trillion in cash on the sidelines. While not all of that is earmarked for stock investments, those who have missed the rally have a real fear of missing out (FOMO) and have been “buying the dips”.
- Markets are “forward looking” and are seeing past the pandemic and current economic morass.
- Debt, while burdensome, has been financed at historically low interest rates, making its servicing more tolerable.
- The flip side of the low interest rate environment is that there is no income available in traditional safe investments like Treasuries and CDs. To get 1% on a CD you have to go out longer than 10 years. To get 1% on a Treasury, you have to go out 20 years!
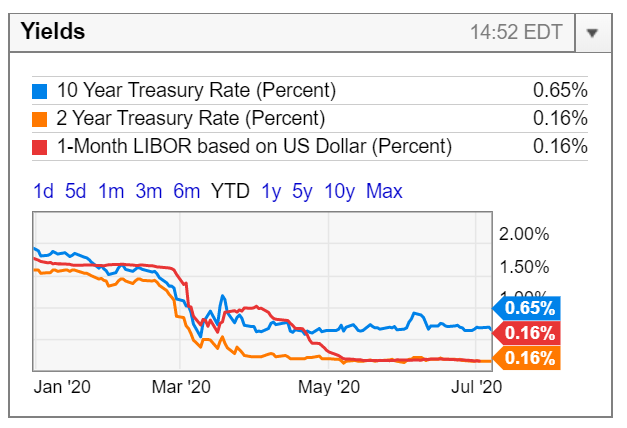
That means, in many cases, there is no alternative (TINA) for dividend stocks. In an unusual occurrence, the dividend yield on the S&P 500 is higher than that of a 10 year Treasury. The last time that happened, stocks outperformed bonds by 11% annually over the next five years.
Another volatility creating factor looming ahead is the election. While we are not political prognosticators, we do need to position portfolios appropriately leading up to and after November (one of our most successful strategies was correctly positioning for a close election in 2016, then quickly repositioning portfolios for the new Trump world order). Those “in the know” currently have Joe Biden ahead by over 10 percentage points. However, they acknowledge there is a lot of time and space for either candidate to do something brilliant or something stupid to swing that outcome. History would seem to back up that data as there has been no president since 1932 to get re-elected when there was a recession within the last 2 years. Of course the argument to that is no president since then has had to face an economy-halting pandemic either.
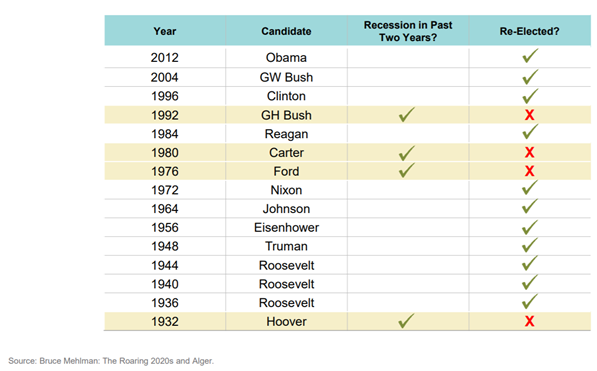
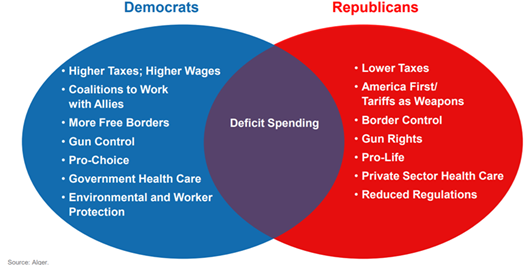
So, what does that mean for the economy and the markets? The impact of the pandemic makes that a little harder than normal to quantify, but we think the chart above from our friends at Alger can be used as a pretty good roadmap. From here, we think a barbell approach to equity portfolios makes sense. We are trimming back some of the stocks that have run so dramatically (the new world stocks) but not moving away from them completely. We are also adding some value names that have been left behind as we think they will benefit from playing catch up with their more growth-oriented brethren. This has exacerbated a trend that has been developing over the last few years and has left the gap between the two uncommonly wide.
Small cap stocks have lagged (still down 13% ytd) and we are just now starting to add back exposure. International stocks are starting to look interesting again.
We started out the year describing the market as riding a wave. Since then, we have ridden the wave, jumped out of the water for a bit, and switched boards. We are now back in the surf and enjoying the new wave of the current market.
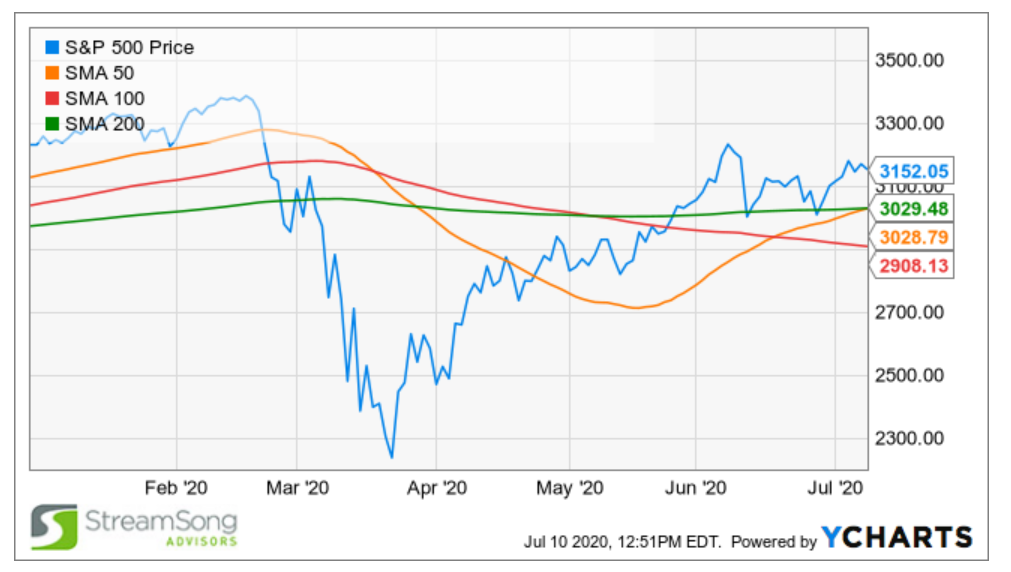
We rely heavily on experience and on technical indicators to guide or tactical allocation decisions. For now, as long as the S&P stays above 3,000 we view this as an investable uptrend. We will respond quickly and proactively if conditions change.